

|
Value and growth are 28 basis points apart over 47 years. The strategy isn't dead: the measurement is broken. We had a look at what the data actually shows.
Twenty-eight basis points.
That is the entire difference between value and growth investing over the last 47 years. The Russell 1000 Value Index returned 11.42% annualized from 1978 through 2025. The Russell 1000 Growth Index returned 11.70%. After nearly half a century, the gap between these two supposedly opposite strategies would not cover most funds' expense ratios.
So when people ask "is value investing dead?" they are asking the wrong question. The real question is whether the way we define and measure value has kept pace with how companies actually create worth. The answer, backed by decades of academic research and market data, is a definitive no.
Value investing is not dead. The thermometer most investors use to measure it is broken.
This piece walks through what the data actually shows: where traditional value metrics fail, why the value premium still exists in purer forms, and what a modern value framework looks like when you fix the measurement problem.
"When people look at market multiples and they compare them to markets of 20 years ago... it used to be that when companies got to a certain scale, their growth would inevitably slow down. [Today] the biggest companies are actually growing faster than ever before... I actually think the stock market may look cheap when we look back."
The timing matters. On May 1, 2026, the eve of Berkshire Hathaway's 61st annual shareholder meeting in Omaha, Bill Ackman and Ryan Israel of Pershing Square Capital Management sat down with UBS for a fireside chat on value investing in an uncertain world. Ackman manages over $35 billion. Israel, his CIO, has been at Pershing Square since 2009. Their conclusions align with what the academic data has been saying: the traditional metrics are broken, the growth rates have changed, and the market may be cheaper than it looks.
The case against value: what the headlines get right
The bearish case for value investing is grounded in real performance data that deserves honest examination.
The Fama-French HML (High Minus Low) factor, the foundational academic measure of the value premium, went negative for the entire decade from 2010 to 2019. This was only the second time since 1926 that the value factor delivered a negative return over a full decade. The first was during the Great Depression.
During this same period, growth stocks dominated in ways that were historically unusual. The Magnificent Seven (Apple, Microsoft, Nvidia, Amazon, Alphabet, Meta, Tesla) accounted for roughly 60% of the S&P 500's total returns in 2023. The top 10 stocks represented 37.3% of the entire index, a level of concentration not seen since the early 1970s.
Even now, the headline numbers create a misleading impression. Ryan Israel made this point at the UBS fireside chat in Omaha on May 1: the S&P 500 started 2026 at approximately 22 times earnings but has since compressed to roughly 20 times, even as the index is up about 6% year-to-date. The maths only works because earnings growth has accelerated to approximately 15% year-over-year, six percentage points above where consensus expected it entering the year. The multiple shrank while prices rose. Investors focused on the headline P/E missed the story underneath it.
Meanwhile, traditional value strategies, those built primarily on price-to-book ratios, suffered. Cheap stocks stayed cheap. Expensive stocks kept getting more expensive. For a full decade, owning statistically "cheap" companies was a losing proposition relative to the market.
The narrative writes itself: value is dead, growth is all that matters, and the old rules no longer apply.
The underperformance of traditional value metrics from 2010 to 2019 is real and significant. Anyone who dismisses it is not being honest with the data. A decade of underperformance does not invalidate a century of evidence. It demands a better explanation for why the traditional metrics failed.
The measurement problem: why book value broke
In 1975, 83% of the S&P 500's market value could be attributed to tangible assets: factories, equipment, inventory, real estate. By 2025, that number had collapsed to just 8%. Intangible assets, intellectual property, software, brand equity, network effects, human capital, now represent 92% of S&P 500 market value.
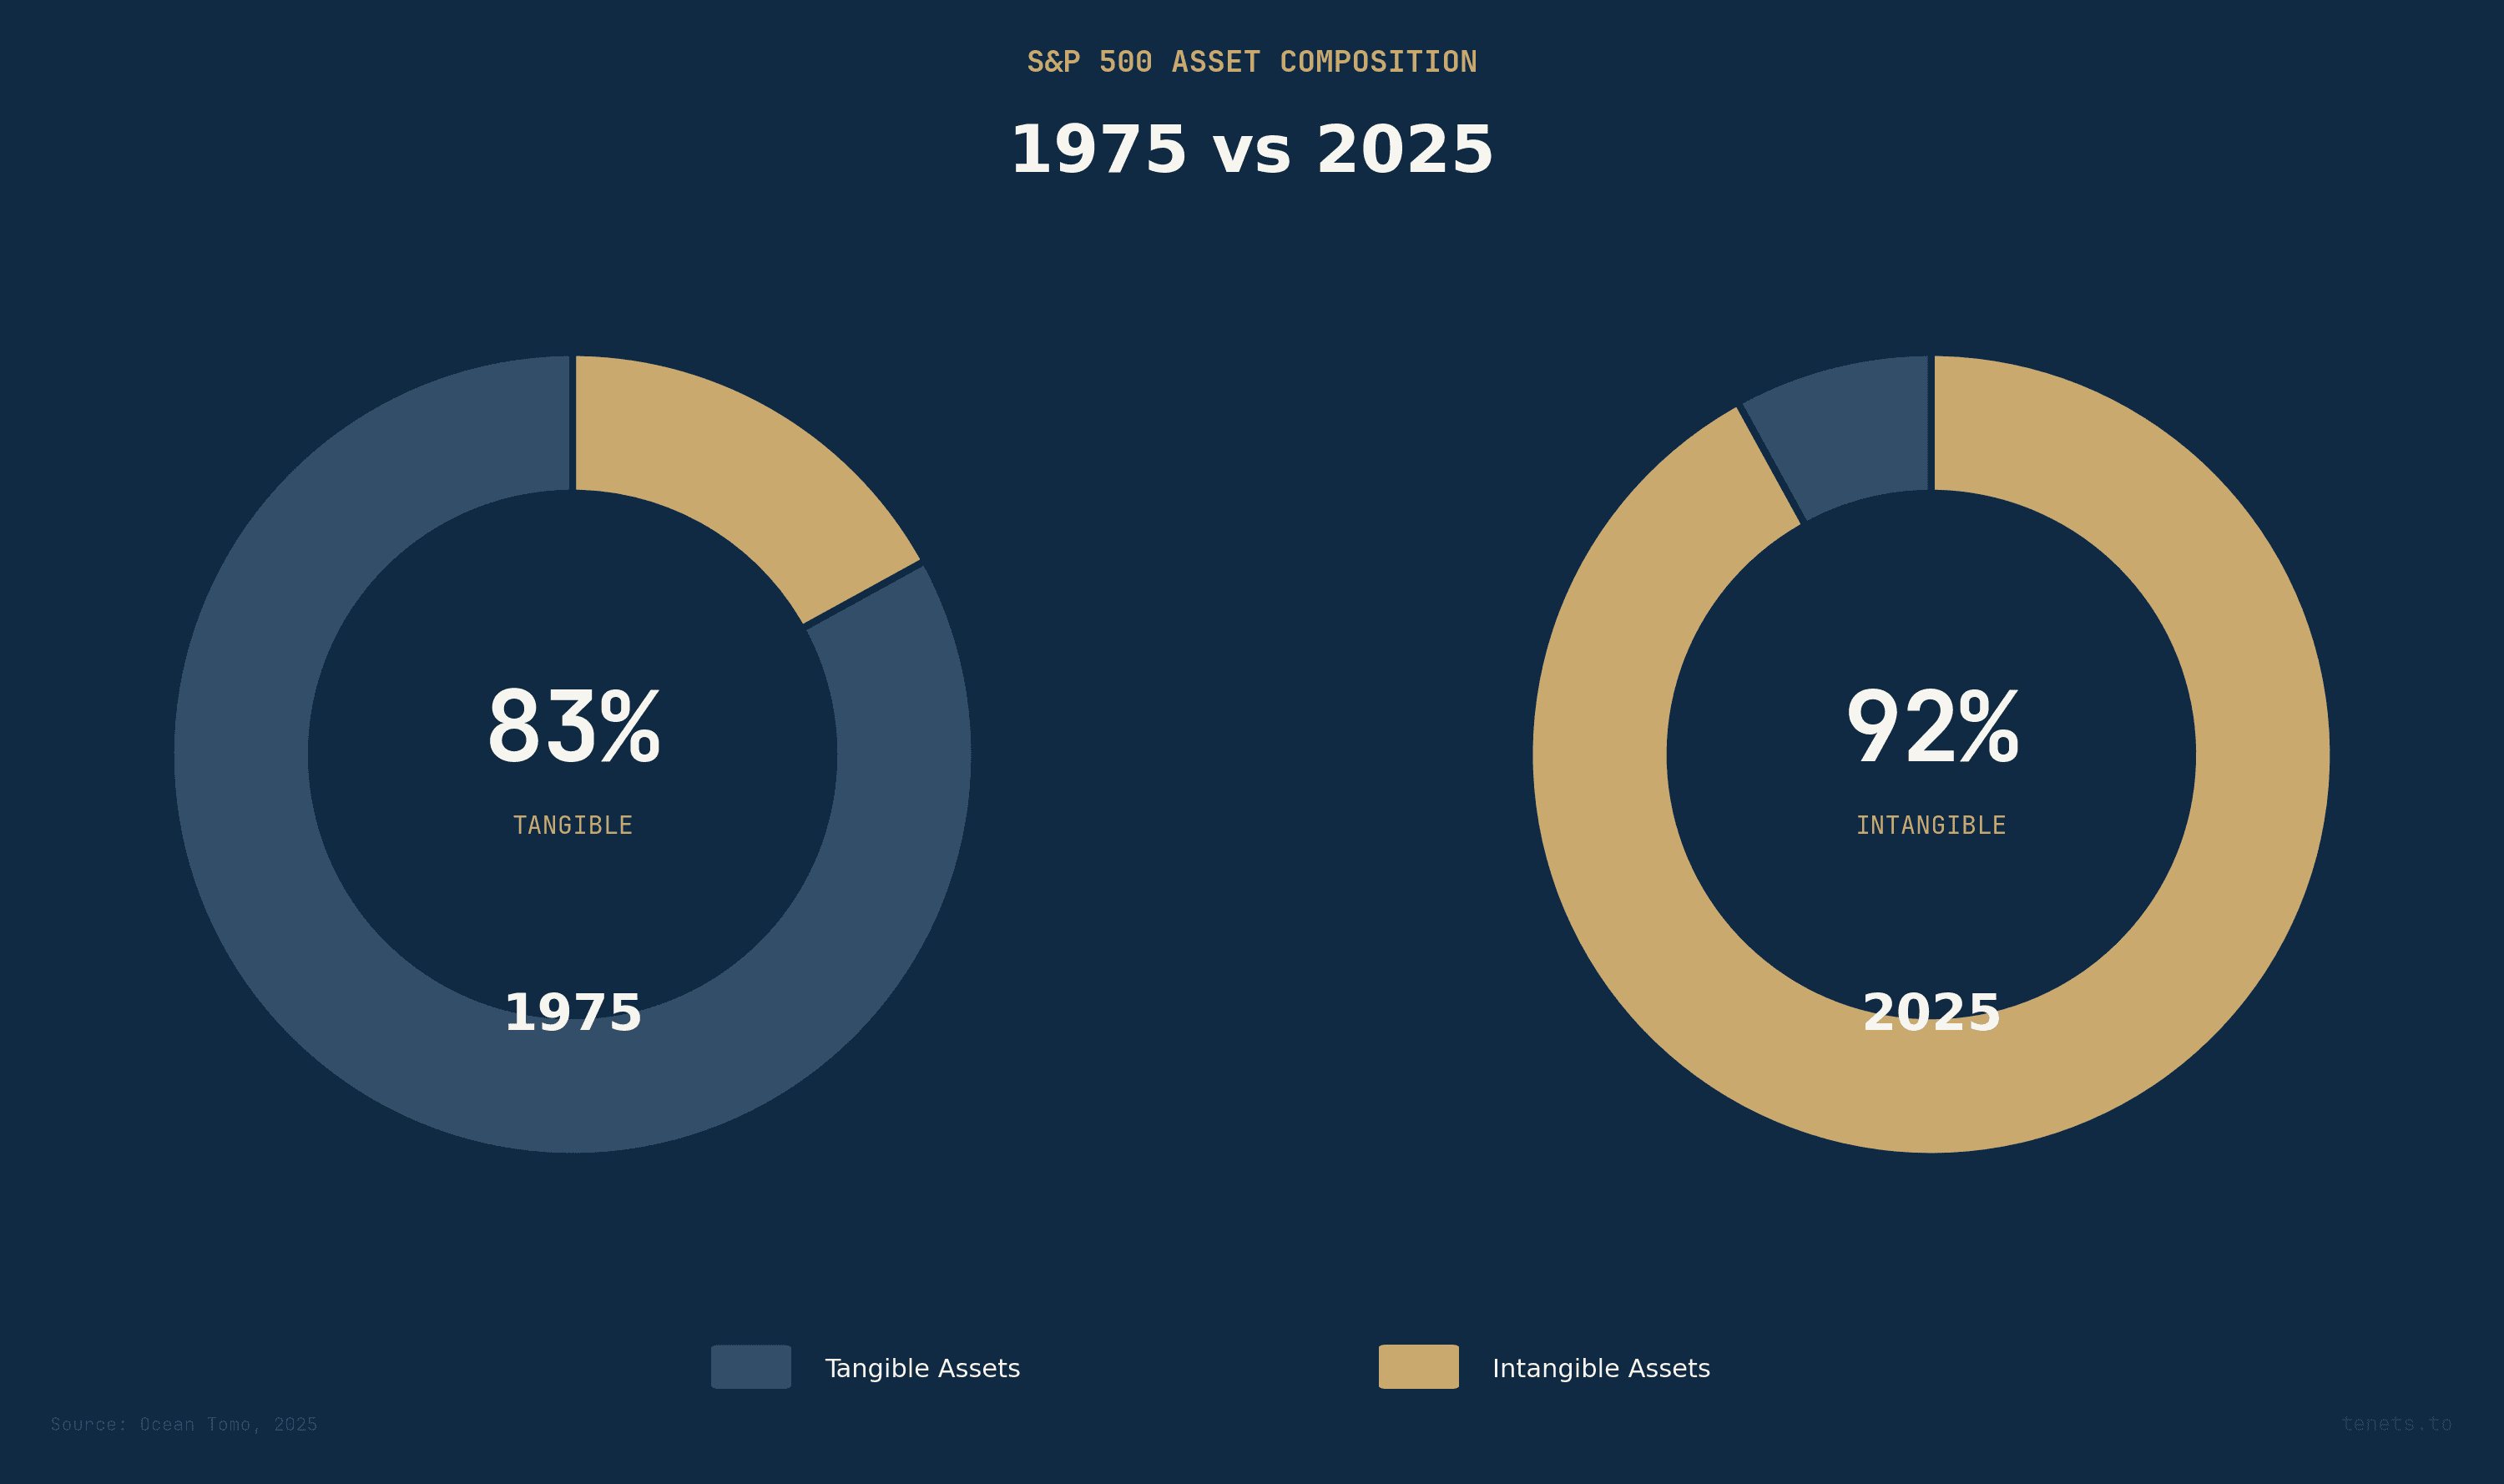
This is a wholesale transformation of what a company is. And it breaks the foundational metric of traditional value investing: price-to-book.
Price-to-book worked when "book value" meant something. When a steel company's assets were blast furnaces and rail cars, book value was a reasonable proxy for liquidation value, replacement cost, and the floor under a stock's price. Ben Graham's entire framework was built in an industrial economy where tangible assets dominated.
Under current accounting standards (GAAP), most intangible investments are expensed immediately rather than capitalised. When Microsoft spends billions on R&D, that spending reduces current earnings and never appears on the balance sheet as an asset. When Google builds a search algorithm worth hundreds of billions, its book value does not reflect that worth.
The result: companies with massive intangible assets look perpetually "expensive" on a price-to-book basis, while companies with heavy tangible assets look perpetually "cheap." Traditional value screens systematically exclude the most innovative companies in the economy, not because those companies are overvalued, but because the accounting does not capture their value correctly.
This is not a theoretical complaint. Research by Baruch Lev and Feng Gu at NYU has documented how the explanatory power of book value for market prices has declined by more than 50% since the 1970s. The metric is measuring an economy that no longer exists.
Bill Ackman made a complementary observation at the Omaha fireside chat: "When people look at market multiples and they compare them to markets of 20 years ago... it used to be that when companies got to a certain scale, their growth would inevitably slow down. [Today] the biggest companies are actually growing faster than ever before... I actually think the stock market may look cheap when we look back." The traditional multiple comparison is doubly broken: the denominator (earnings) understates real economic earning power because intangible investments are expensed, and the numerator (price) fails to reflect the structural acceleration in growth rates that Ackman describes.
Price-to-book ratio was designed for an industrial economy where 83% of corporate value was tangible. In a world where 92% of value is intangible, using P/B as your primary value screen is like using a thermometer to measure wind speed. The instrument is not wrong. It is measuring the wrong thing.
The value premium is not dead: it is hiding in better metrics
If you look beyond price-to-book and examine more sophisticated measures of value, the premium is alive and, in many cases, thriving.
Piotroski F-Score
Joseph Piotroski's 2000 paper demonstrated that you could generate +7.5% annual alpha simply by applying a basic financial health screen within the universe of value stocks. His F-Score, a 9-point checklist covering profitability, leverage, and operating efficiency, separated the genuinely cheap-and-good from the cheap-and-broken. Traditional value investing treats all cheap stocks the same. The F-Score shows that the value premium concentrates almost entirely in financially healthy cheap stocks. The junk drags the average down.
Novy-Marx gross profitability
Robert Novy-Marx at the University of Rochester found that gross profitability has roughly the same predictive power for future stock returns as book-to-market ratio, but the two factors are negatively correlated. Companies with high gross profitability tend to look like growth stocks on traditional metrics. The traditional value/growth divide is creating a false binary. Some of the best "value" investments, in the sense of buying more future cash flow per dollar, are companies that traditional screens classify as growth.
AQR's quality minus junk
AQR Capital Management's research quantified what many practitioners suspected: high-quality companies (profitable, growing, safe, well-managed) systematically outperform low-quality companies by 42 to 52 basis points per month. More importantly, the quality factor is negatively correlated with the traditional value factor. When traditional value underperforms, it is often because the value basket is full of low-quality companies. Quality and value are complementary factors that, when combined, produce more consistent returns than either alone.
The Magic Formula: Combining Value and Quality
Joel Greenblatt's approach, which ranks stocks on both earnings yield (a value metric) and return on capital (a quality metric), returned 30.8% annualized from 1988 to 2004, compared to 12.4% for the S&P 500. The outperformance came from the combination, not from value alone or quality alone.
The value premium has not disappeared. It has migrated from simple price-to-book screens to multi-factor approaches that combine cheapness with quality, profitability, and financial health.
The value spread: why timing matters now
Even for traditional value metrics, there is a powerful mean-reversion signal in the data.
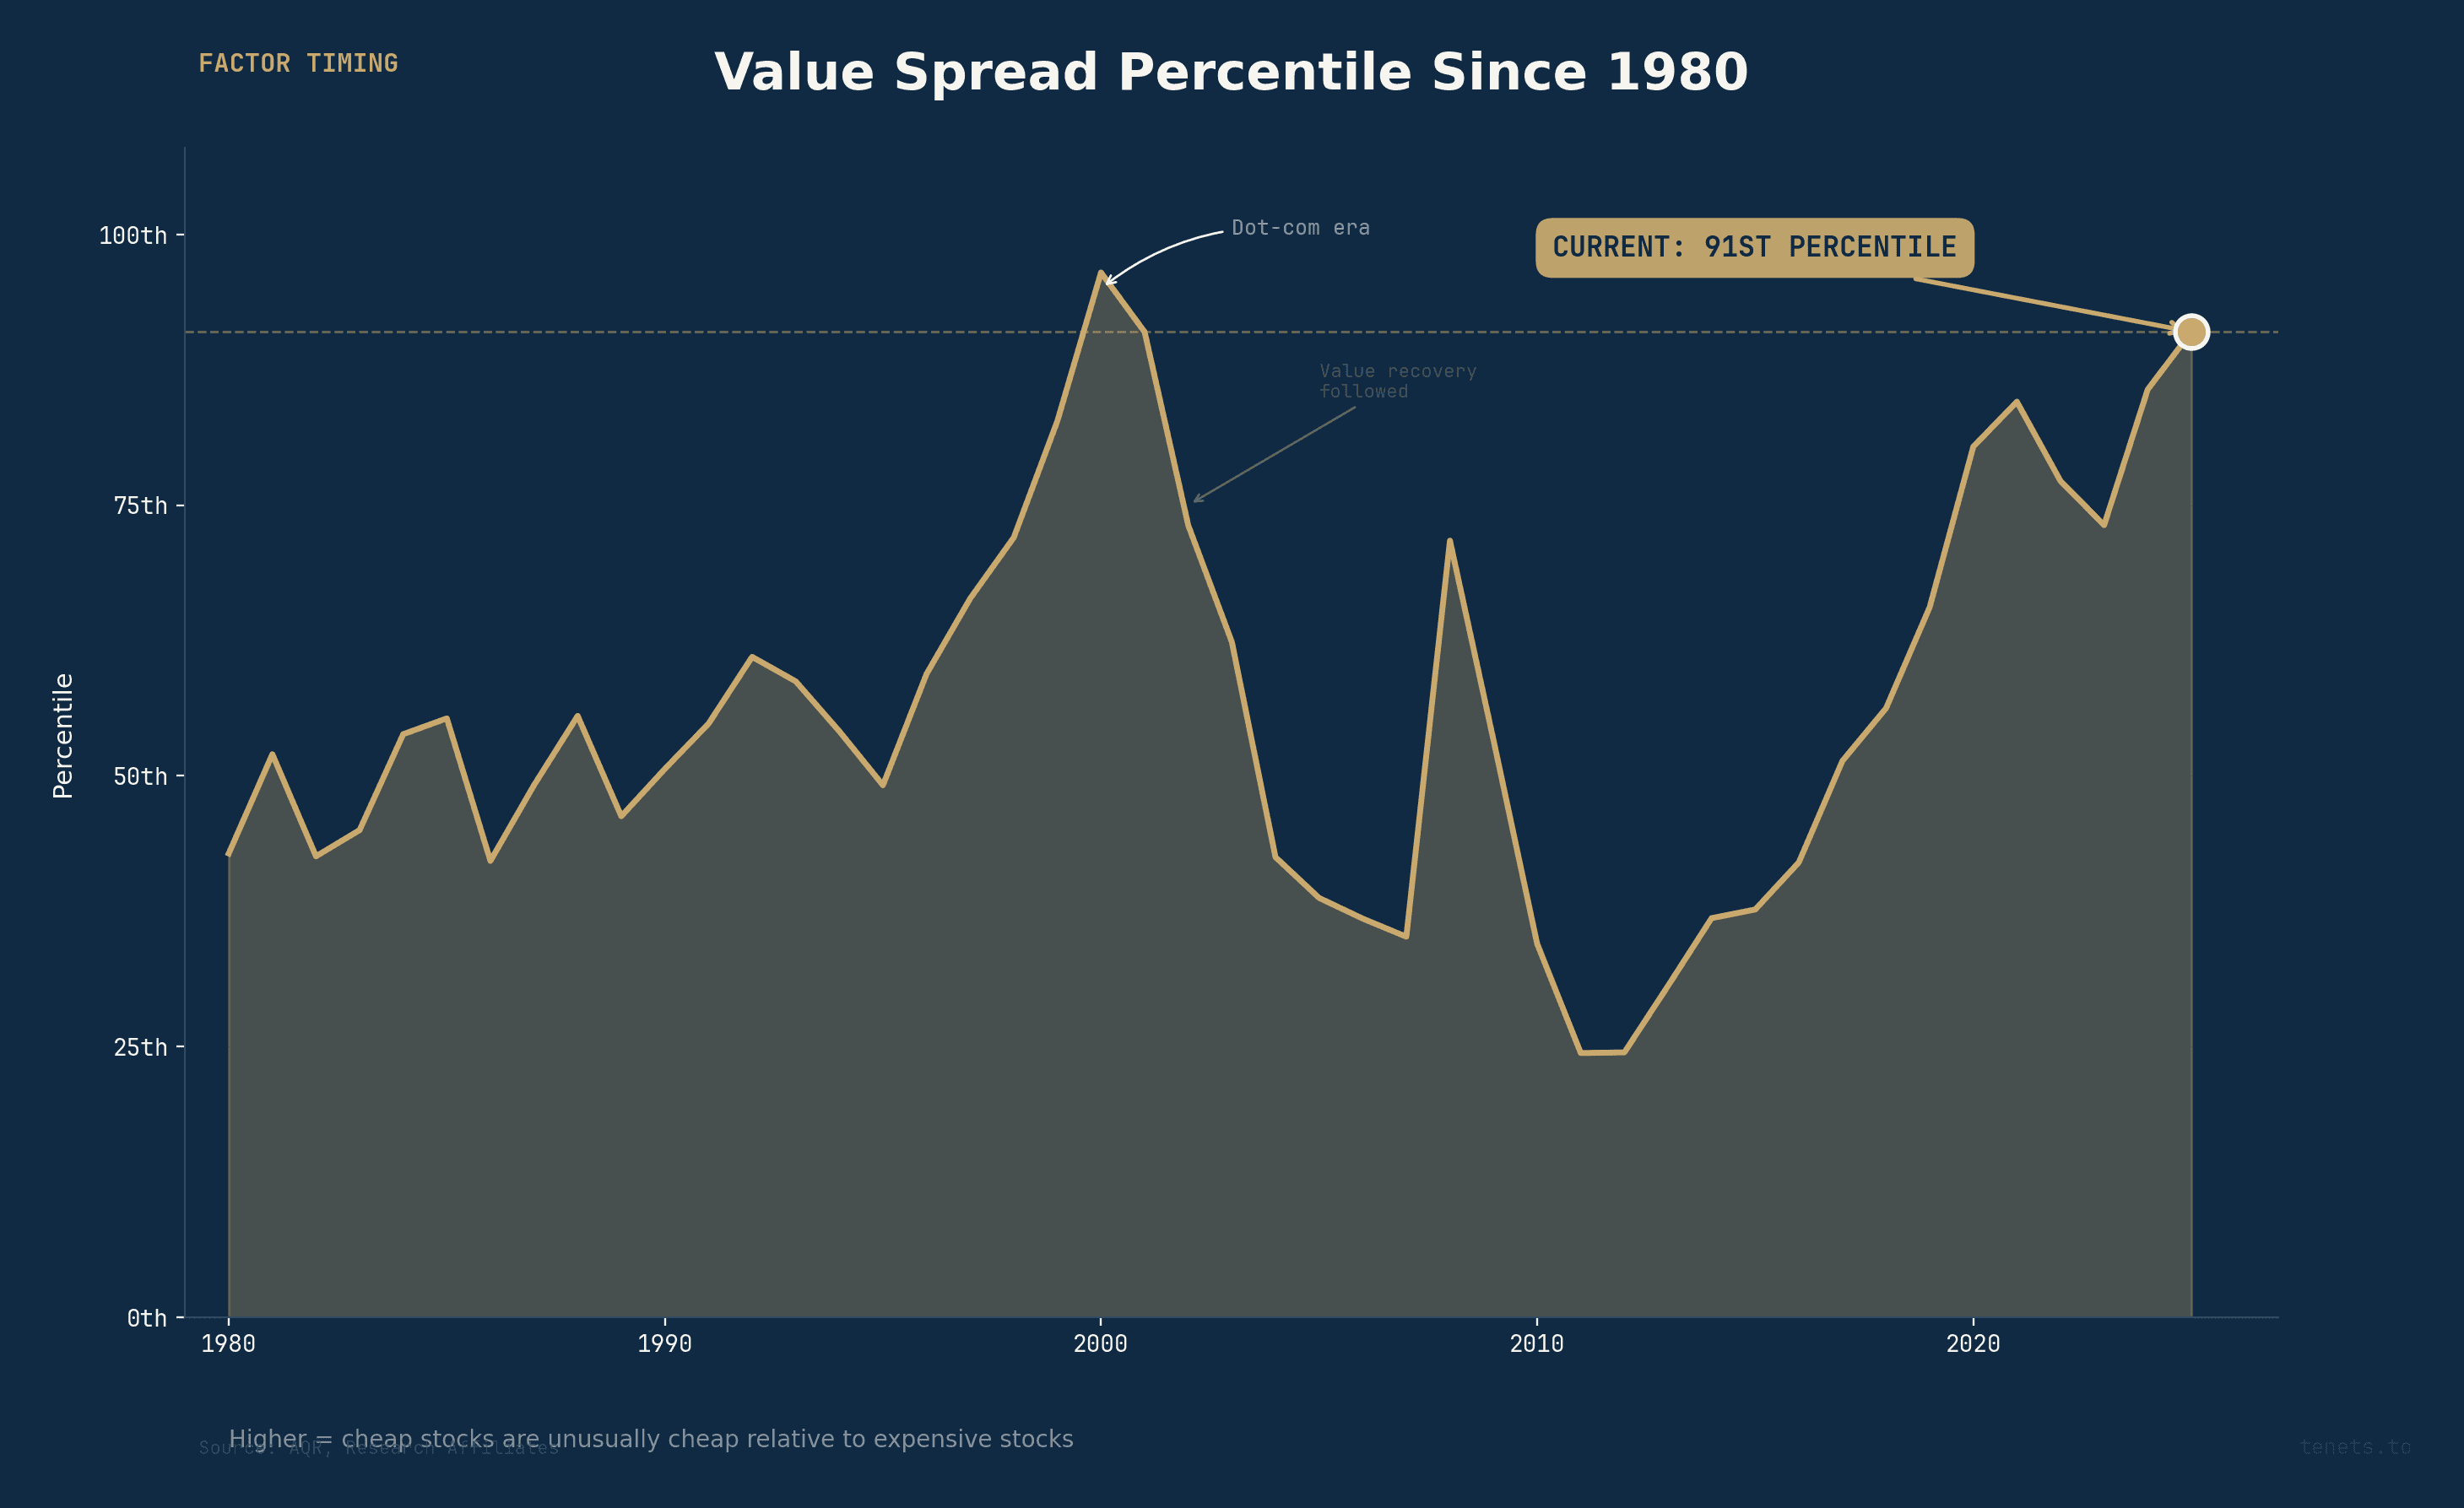
The value spread, the gap in valuation between the cheapest and most expensive stocks, currently sits at the 91st percentile since 1980. Cheap stocks are historically cheap relative to expensive stocks. The gap has rarely been wider.
Historically, extreme value spreads have preceded strong value recoveries. This is not a timing call; mean reversion can take years. It does establish that the starting conditions for value today are unusually favourable by historical standards.
The early evidence of a rotation is already appearing. MSCI EAFE Value (international developed markets) returned +43.26% in 2025. Russell 2000 Value (US small-cap value) returned +45.8% trailing 12 months through May 2026. AQR's flagship value fund returned +43.5% in 2022, followed by +18.5% in 2023.
These are not marginal returns. They suggest that the value factor, even in its traditional form, is experiencing the kind of snapback that wide spreads historically predict.
What modern value investing actually looks like
The research points clearly toward what a modern value framework requires. It is about updating the definition of value to match today's economy.
A modern value approach needs to account for intangible assets. R&D spending, software development costs, and brand-building expenditures need to be capitalised and amortised rather than treated as pure expenses. This gives a more accurate picture of a company's true asset base and true earnings power.
It needs to integrate quality signals. Cheapness alone is not enough. Financial health (Piotroski), profitability (Novy-Marx), and overall quality (AQR's QMJ) must be combined with valuation metrics to separate genuine bargains from value traps.
It needs multiple valuation lenses. No single metric captures value in all contexts. Enterprise value to operating income, free cash flow yield, earnings yield adjusted for intangible investment, and sector-relative valuations each reveal different facets of cheapness.
And it needs to adapt to sector composition. A framework that applies industrial-era metrics to a software company is not doing value investing. The approach must flex based on how a company creates and captures value.
This is not a departure from first principles. Graham and Dodd's core insight was to buy assets for less than they are worth. The assets have changed. The principle has not.
The disruption factor: even Buffett got this wrong
There is one more dimension to the measurement problem that deserves attention, and it was articulated clearly in Omaha.
Bill Ackman made a striking admission during the fireside chat: "If you go back and read the Berkshire letters, Buffett talked about these really wonderful businesses like World Book Encyclopedia. That was one of his favorite businesses. Newspapers. Go back in time. Look how many Berkshire businesses disappeared over time. So the greatest investor of all time, even he misunderstood disruption, at a time when disruption was not nearly as fast as it is today."
Ryan Israel extended the point: the speed of technological change, particularly AI, is accelerating disruption to a degree that makes traditional value screens even more dangerous. "In a world where change is happening more rapidly, what are the things that won't be changing? That's a really big focus for us on capital allocation."
Buying statistically cheap stocks without evaluating the durability of their business model is not value investing. It is a bet that yesterday's economics will persist tomorrow, a bet that Buffett himself lost on World Book, newspapers, and several other Berkshire holdings.
Modern value investing must include a disruption filter. Cheapness without durability is a trap. The quality signals, Piotroski F-Score, gross profitability, return on capital, serve precisely this function: they separate companies that are cheap because the market is wrong from companies that are cheap because the market is right.
How Tenets approaches this problem
This is the problem Tenets was built to solve.
The Tenets engine does not rely on a single valuation metric or a static screen. It implements the multi-factor framework that the academic research supports, combining valuation, quality, profitability, and financial health into a unified scoring system that adapts to the realities of modern corporate structure.
The engine capitalises intangible investments when evaluating a company's true asset base and earnings power. R&D-heavy companies are not automatically penalised for investing in their future. It applies quality filters drawn from Piotroski, Novy-Marx, and AQR's research to separate financially healthy cheap stocks from value traps. It uses multiple valuation frameworks simultaneously rather than relying on any single ratio, because different business models require different lenses. And it evaluates factor exposures in context: when value spreads are wide, as they are now, the expected return to value exposure is higher.
Every stock scored on Tenets receives a transparent breakdown of where its score comes from: which factors are driving the rating, which are dragging it down, and how confident the system is in its assessment. No black boxes.
You can see how this works for any stock by joining the waitlist to try Tenets free.
The bottom line
Value investing is not dead. The obituaries have been written by people who define "value" as a single ratio (price-to-book) in an economy where that ratio has lost most of its explanatory power.
When you update the measurement, accounting for intangible assets, integrating quality and profitability signals, using multiple valuation lenses, the value premium is alive, well-documented, and currently supported by historically wide value spreads.
The 28-basis-point gap between the Russell 1000 Value and Growth indices over 47 years does not prove that value is dead. It proves that the indices are poorly constructed for a modern economy. Better tools produce better results.
The question is not whether to be a value investor. The question is whether your definition of value has kept pace with how companies actually create it.
Stay ahead of the research. We publish deep dives on factor investing, market structure, and quantitative strategy every week. No fluff, no hype: just data and analysis.
Subscribe to The Tenet newsletter
Sources
FTSE Russell. "Russell 1000 Value Index & Russell 1000 Growth Index: Historical Performance Data, 1978–2025." FTSE Russell Factsheets.
Fama, Eugene F. and Kenneth R. French. "The Cross-Section of Expected Stock Returns." The Journal of Finance, Vol. 47, No. 2 (June 1992), pp. 427–465.
Ocean Tomo. "Intangible Asset Market Value Study, 2025." Annual study of S&P 500 asset composition.
Piotroski, Joseph D. "Value Investing: The Use of Historical Financial Statement Information to Separate Winners from Losers." Journal of Accounting Research, Vol. 38, Supplement (2000), pp. 1–41.
Novy-Marx, Robert. "The Other Side of Value: The Gross Profitability Premium." Journal of Financial Economics, Vol. 108, No. 1 (April 2013), pp. 1–28.
Asness, Clifford S., Andrea Frazzini, and Lasse Heje Pedersen. "Quality Minus Junk." Review of Accounting Studies, Vol. 24, No. 1 (2019), pp. 34–112.
Greenblatt, Joel. The Little Book That Beats the Market. Wiley, 2006. Backtested results 1988–2004.
AQR Capital Management. "Is (Systematic) Value Investing Dead?" White paper, February 2021.
Lev, Baruch and Feng Gu. The End of Accounting and the Path Forward for Investors and Managers. Wiley, 2016.
MSCI. "MSCI EAFE Value Index Performance Data, 2025." MSCI Index Factsheets.
FTSE Russell. "Russell 2000 Value Index: Trailing 12-Month Performance through May 2026." FTSE Russell Factsheets.
Arnott, Rob, Campbell Harvey, Vitali Kalesnik, and Juhani Linnainmaa. "Reports of Value's Death May Be Greatly Exaggerated." Research Affiliates, January 2021.
Israel, Ronen, Kristoffer Laursen, and Scott Richardson. "Is (Systematic) Value Investing Dead?" The Journal of Portfolio Management, Vol. 47, No. 2 (2021).
Fama, Eugene F. and Kenneth R. French. "The Value Premium." The Review of Financial Studies, Vol. 34, No. 4 (2021), pp. 2073–2107.
UBS Wealth Management. "Value Investing in an Uncertain World: A Fireside Chat with Bill Ackman and Ryan Israel." UBS Events, May 1, 2026, Omaha, NE.
Every Sunday evening, one company analysed like you always meant to. Safety screens. Quality checks. Valuation models. Every assumption visible. No black boxes.
Free. No spam. Unsubscribe anytime.


